Author: Nghia Nguyen
In this article, I take the Apache Spark service for a test drive. It is the third in our Synapse series: The first article provides an overview of Azure Synapse, and in our second, we take the SQL on-demand feature for a test drive and provided some resulting observations.
This article contains the Synapse Spark test drive as well as cheat sheet that describes how to get up and running step-by-step, ending with some observations on performance and cost.
Synapse Spark Architecture
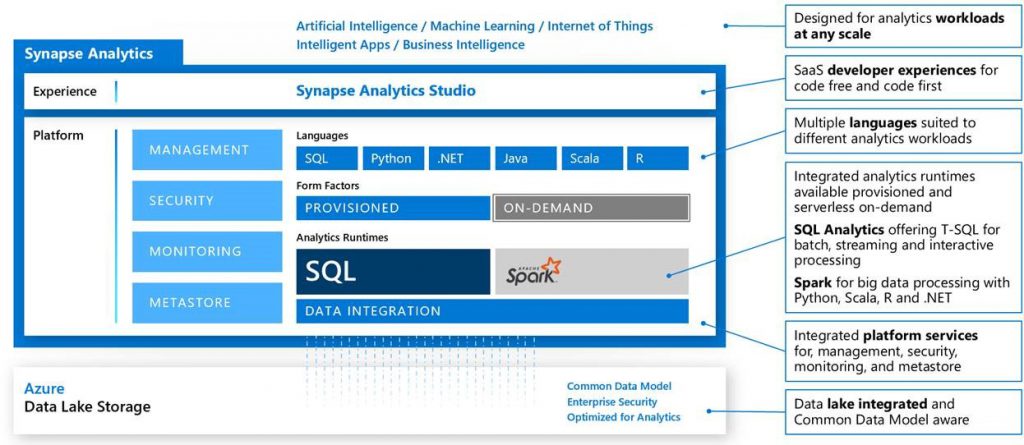
The Spark pool in Azure Synapse is a provisioned and fully managed Spark service, utilising in-memory cache to significantly improve query performance over disk storage.
https://docs.microsoft.com/en-us/azure/synapse-analytics/spark/apache-spark-overview
As Spark pools are a provisioned service, you pay for the resources provisioned and these can be automatically started up and paused when the Spark pool is in use. This can be controlled per Spark pool via the two configurations Auto-pause and Scale, which I will discuss later in this post.
Based on the Azure Pricing calculator, https://azure.microsoft.com/en-au/pricing/calculator/, the cost is based on a combination of the instance size, number of instances and hours of usage.
Why Spark pool?
- Data scientists can run large amounts of data through ML models
- Performance, the architecture auto-scales so you do not have to worry about infrastructures, managing clusters and so on.
- Data orchestration effortless inclusion of spark workloads in notebook
Who Benefits?
- Data scientists: collaborating, sharing and operationalising workflows that use cutting edge machine learning and statistical techniques in the language that fits the job is made simple.
- Data engineers: complex data transformations can easily be replicated across different workflows and datasets in an obvious way.
- Business users: even without a deep technical background, the end users of the data can understand and participate broadly in the preparation of their data and advise and sense-check with the capabilities that only a subject matter expert has.
- Your business: data science processes within Azure Synapse are visible, understandable and maintainable, dismantling the ivory silo data science often occupies in organisations.
Steps to get up and running
I have already provisioned a data lake, the Azure Synapse Analytics workspace and some raw parquet files. In this section, I will:
- Access my Azure Synapse Analytics workspace.
- Provision a new Spark pool
- Create a new Notebook with Python as the chosen runtime language
- Configure my notebook session
- Add a cell and create a connection to my Data Lake
- Run some cells to test queries on my parquet files in the Data Lake
- Run another runtime language in the same notebook
Step 1 – Access my Synapse workspace
Access my workspace via the URL https://web.azuresynapse.net/
I am required to specify my Azure Active Directory tenancy, my Azure Subscription, and finally my Azure Synapse Workspace.
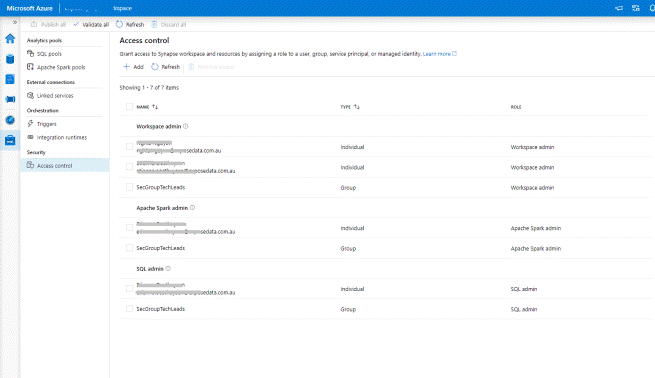
Before users can access the data through the Workspace, their access control must first be set appropriately. This is best done through Security Groups, but in this quick test drive, I used named users.
When I created Azure Synapse Analytics, I specified the data lake I want to use, this is shown under Data > Linked > data lake > containers. I can, of course, link other datasets, for example, those in other storage accounts or data lakes here too.
Step 2 – Create a new Apache Spark pool
In the Manage section of the Synapse workspace, I navigated to the Apache Spark pools and started the wizard to create a new Spark pool.
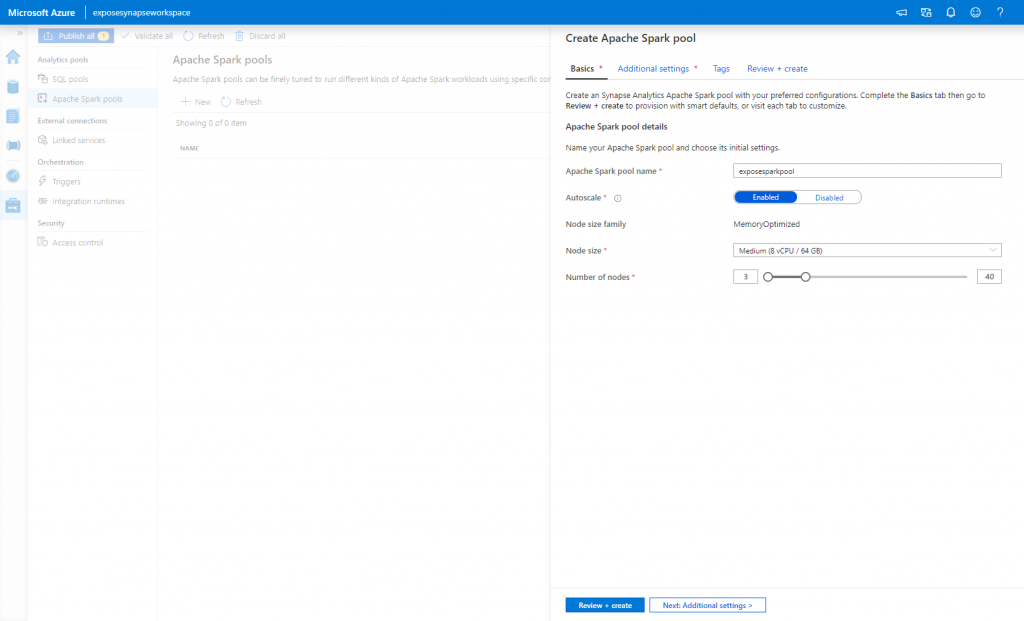
On the first screen ‘Basics’ of the Spark pool provisioning I had to take careful note of the multiple options available, more specifically;
Autoscale
If enabled, then depending on the current usage and load, the number of nodes used will increase/decrease. If disabled, then you can set a pre-determined number of nodes to use
Node size
This will determine the size of each node. For a quick reference, currently there are 3 sizes available, small, medium and large with the rough cost in AUD per hour for each node being $0.99, $1.97 and $3.95 respectively.
Number of Nodes
This determines the number of nodes that will be consumed when the Spark pool is online. As I selected to Enable the Autoscale setting above it, I get to now choose a range of nodes which determines the minimum and maximum number of nodes that can be utilised by the Spark pool.

If I were to Disable the Autoscale setting, I would only get to select the maximum number of nodes the Spark pool can use at a time.

Both options have a minimum of 3 nodes limit.
For the purpose of our tests, I selected the Medium sized node, enabled Auto-scale and left the default 3 to 40 number of nodes.
Continuing on to the ‘Additional Settings’ I left the default settings here.
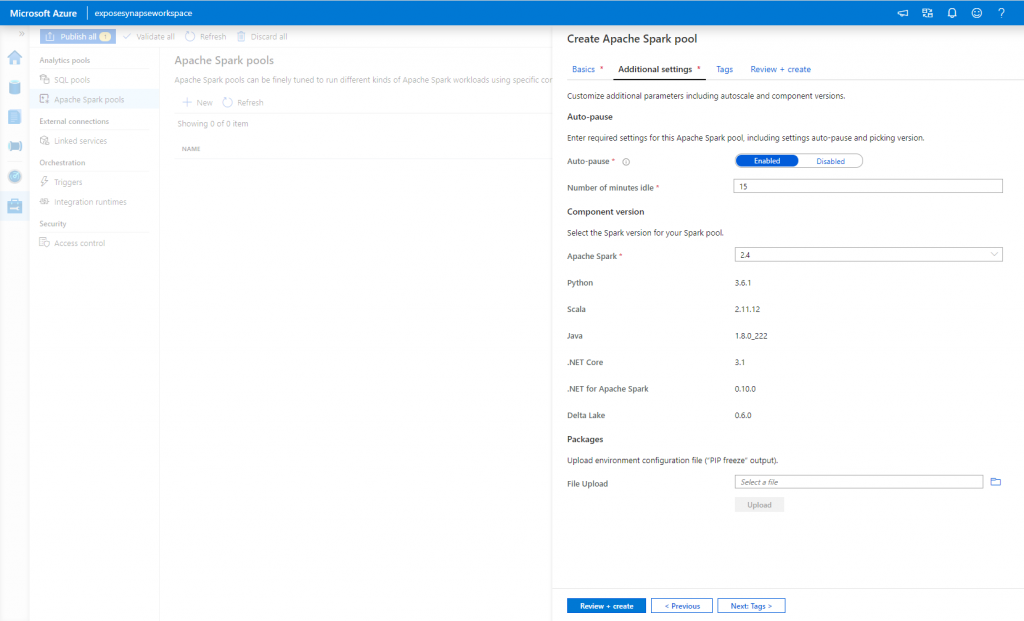
The main configuration setting that caught my focus was the Auto-pause option in which you can define how long the Spark pool will stay idle for before it automatically pauses.
Review and create the Spark pool.
Step 3 – Create a new Notebook with Python as the runtime language
Advanced analytics (including exploration and transformation of large datasets and machine learning using Spark) is delivered through a notebooks environment that is very similar to Databricks. Like Databricks you choose your default language, attach your notebooks to compute resources, and run through cells of code or explanatory text.
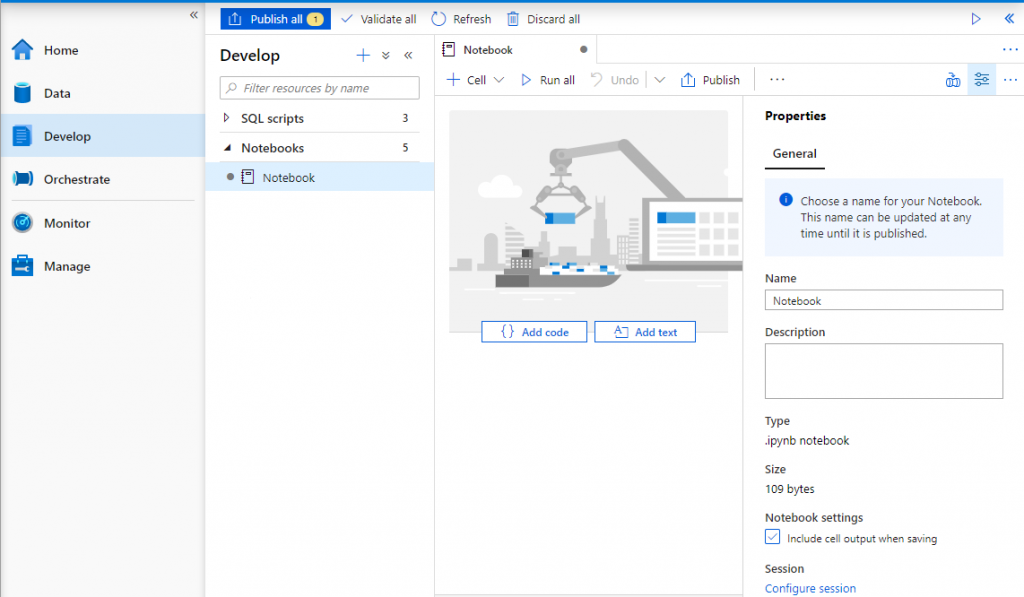
To get started, I added a new notebook in the Develop section of the Synapse workspace.
At a glance, there are some notable differences in language choices when compared to Databricks
- R language is not available yet in the notebook as an option (this appears to be on the horizon though)
- Synapse additionally allows you to write your notebook in C#
Both Synapse and Databricks notebooks allow code running Python, Scala and SQL.
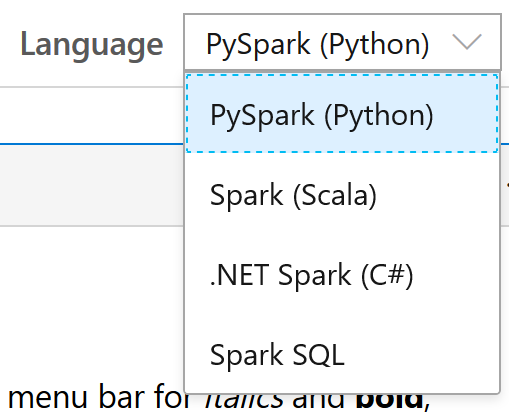
Synapse Spark notebooks also allow us to use different runtime languages within the same notebook, using Magic commands to specify which language to use for a specific cell. An example of this in Step 7.
More information on this can be found in the following Microsoft documentation.https://docs.microsoft.com/en-us/azure/synapse-analytics/spark/apache-spark-development-using-notebooks#develop-notebooks
Step 4 – Configure my notebook session
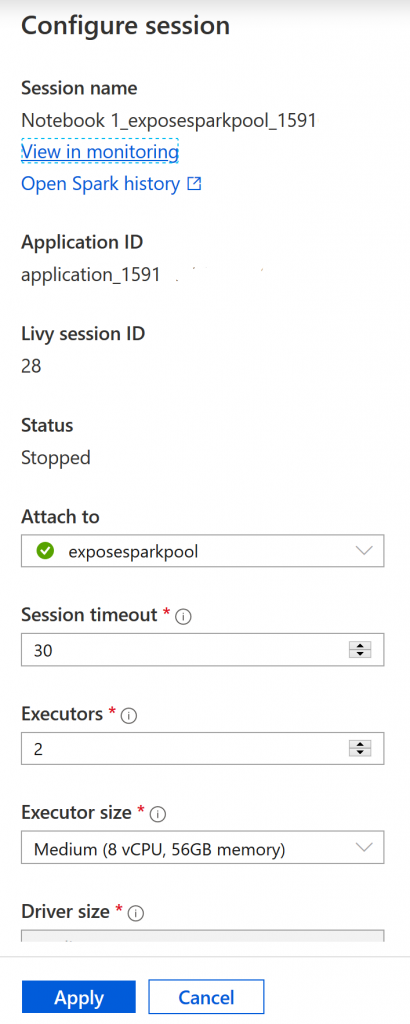
Notebooks give us the option to configure the compute for the session as we develop. Compute configuration in Synapse is a dream – you specify the pool from which compute is borrowed, and the amount you want to borrow and for how long. This is a really nice experience.
Step 5 – Add a cell and create a connection to my Data Lake
In the first instance, I added two cells, one for describing the notebook and the second one to create a connection to my Data Lake files with a quick count.
Documentation cells – in Databricks, you must know Markdown Syntax in order to write your documentation cells and format them. In Synapse, there are nice helpers so that for example, you don’t have to remember which brackets are which when writing hyperlinks and so on.

Connectivity – to connect to the Data Lake, I’ve used the Azure Data Lake Storage (ADLS) path to connect directly. This is a really convenient feature as it inherits my Azure Role Based Access Control (RBAC) permissions on the Data Lake for reading and writing, meaning that controlling data access can be done at the data source, without having to worry about mounting blob storage using shared access signatures like in Databricks (although access via a shared access signature can also be put in place.
The ADLS path is in the following format:
abfss://<container_name>@<storage_account_name>.dfs.core.windows.net/<path>
Also adding a quick row count in the parquet files, running the cell initially takes around 2 minutes and 15 seconds as it needs to spin up the spark pool and corresponding nodes (after seeing this happen a few times over the course of a few days, this spin up time varied from durations of 1 minute and sometimes taking up to 4 minutes). A subsequent run only takes just under 3 seconds to count the rows from 19 parquet files.
Step 6 – Run some cells to test queries on my parquet files in the Data Lake
In the previous step, I also added a reader on the parquet files within my Data Lake container. Let’s first display the contents using the code
display(sdf_kWh)Running the notebook cell gives us a preview of the data directly under the corresponding cell, taking just 3.5 seconds to execute and display the top 1000 records.
From the simple display, I now run a simple aggregate with ordering, which takes 9 seconds to run.
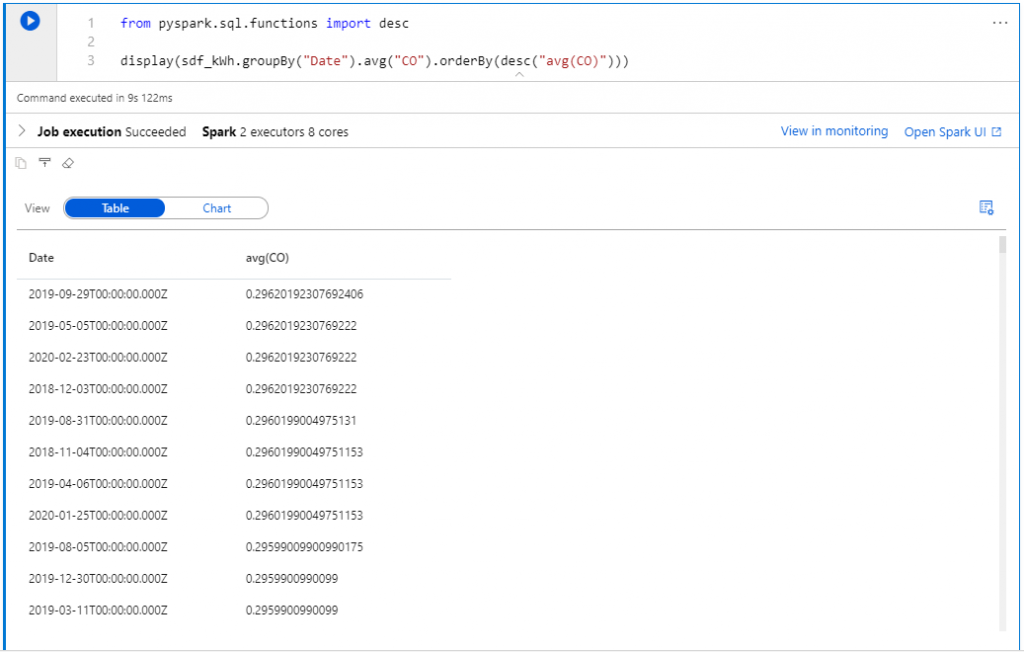
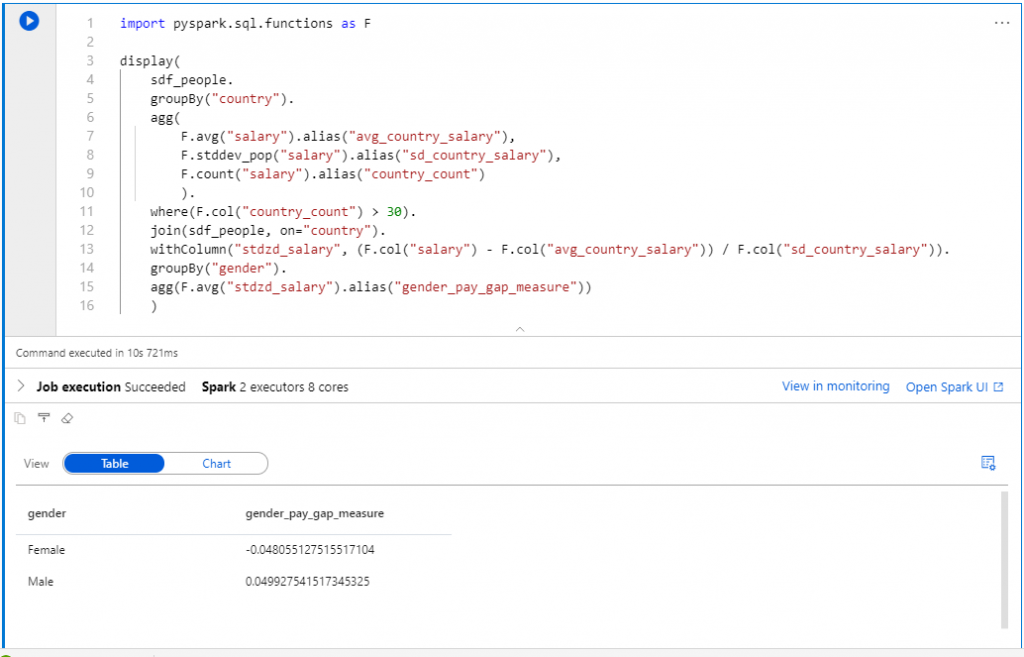
Using another set of parquet files in the same Data Lake, I ran a slightly more complex query, which returns in around 11 seconds.
Step 7 – Run another runtime language in the same notebook
In Synapse, a notebook allows us to run different runtime languages in different cells, using ‘magic commands’ that can be specified at the start of the cell.
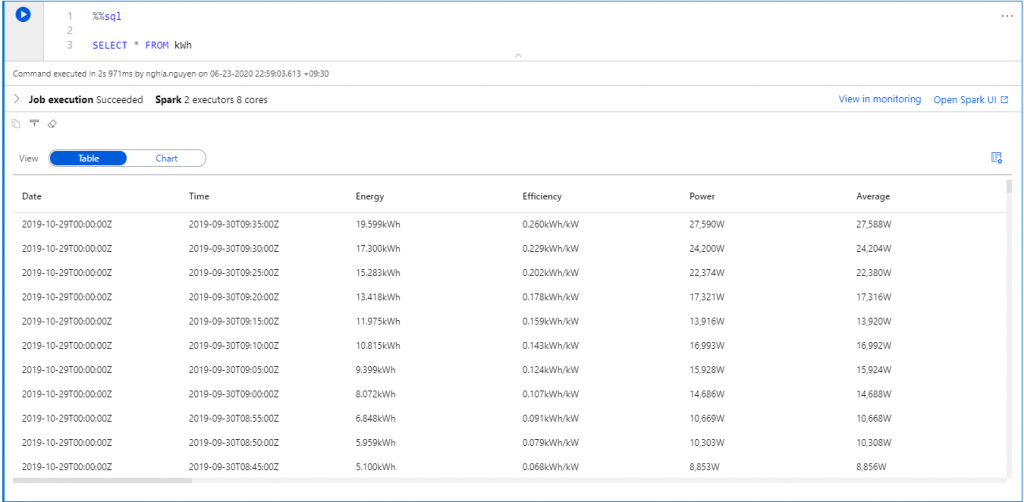
I can access the data frames created in a previous cell using Spark Python within the same notebook and query it with a simple select statement in SQL syntax.
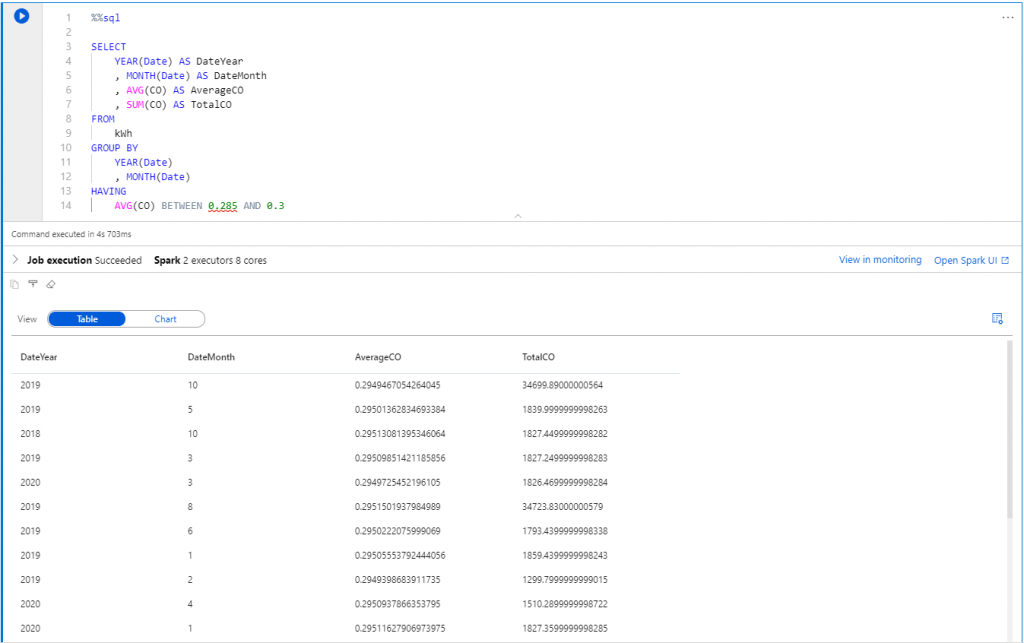
Or an aggregation in SQL syntax.
Other Observations
Publishing
Once all my cells were coded and working as intended, I proceeded to publish the notebook. Comparing the publishing paradigm to Databricks, Synapse works by having users publish their changes, giving the opportunity to test, but reverting the changes does not appear to be simple currently. Databricks exposes a full history of changes to notebooks, which is useful for assessing who changes what and reverting accidental changes.
Orchestration
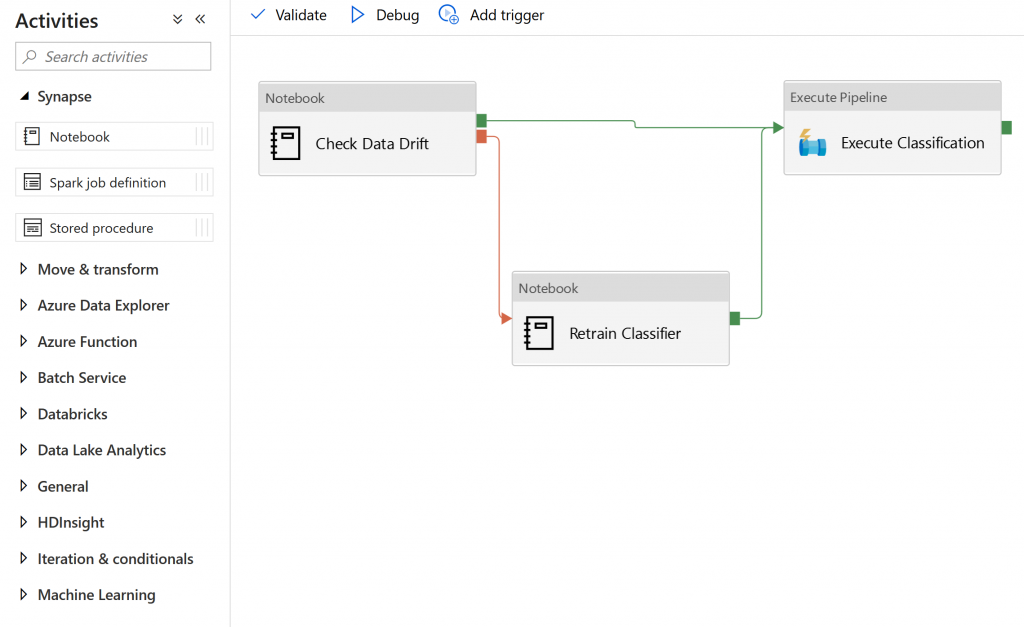
Orchestration is another nice experience Synapse has to offer. After developing a notebook that accomplishes a task such as training a classification model, you can immediately add your notebook to a Data Factory pipeline as a task and choose the circumstances that should trigger your notebook to be run again. This is very simple to do and very easy to understand, especially given the excellent Data Factory pipeline interfaces that Azure.
Flexibility
Databricks gives the user quite good visibility of the resources on which the cluster is running – it allows the user to run shell commands on the Spark driver node and provides some utility methods for controlling Databricks (such as adding input parameters to notebooks). This does not appear to be the experience that Synapse is going for, potentially to some detriment. In one engagement, it proved very useful that Databricks exposed the shell of the machine running code as it enabled us to send commands to a separate piece of specialised optimisation software that we compiled on the machine.
Performance Observation
Although the use cases in this blog are limited and the size of data is quite small, it did give an indication of basic performance with simple commands. I gave up on speed testing since caching and random variation is just too much of an effect. Spark works faster than a single machine on large enough data, that’s all we really need to know.
A summary of the performance we’ve seen so far using 2 executors and 8 cores on medium sized instances.
| Task | Duration |
| Initial spin up of the pool | 1 to 4 minutes |
| Row count of ~600k records | Under 3 seconds |
| Display top 1000 rows | 3.5 seconds |
| Aggregate over Dates | 9 seconds |
Cost Observation
Pricing of the Spark pool is calculated by up time of the pool, so you only pay for when there is activity (a running notebook/application) on the Spark pool and also inclusive of the idle minutes configured in the Auto-pause functionality, in my case this is 15 minutes.
With a decent amount of use sporadically over two weeks, I observed a cost of nearly $100 AUD. Bear in mind that I did utilise the Medium sized instances with auto-scaling set to a maximum of 40 nodes, which was in hindsight overkill for what it was actually used it for.
