
Author: Etienne Oosthuysen
Power BI recently announced the extension of its commentary capability to Power BI reports. Yes, you can now add comments to both report pages or specific visuals to improve your data discussions!
These conversations are automatically bookmarked, so the report context is retained exactly as the comment was written, complete with the original filters. Reporting by exception is embraced with those mentioned by @mentions receiving a push notification to their mobile device to alert them.
Whilst commentary is nothing new in BI tools – Power BI is a bit late to the game – its here now and we’ve subsequently put it through its paces to see how it stacks up!
Backstory
The following exposé samples show the analysis for a retail organisation. The data, which updates hourly, is sourced from 3 different on-premise systems and modelled into a user-friendly sales model with a specific focus on Products, Customers and Suppliers & Export. The Head of Sales noticed an unusual spike in sales (in $ terms) back in April and created a comment for his sales managers to see. His sales manager picked up the comment and conducted the visual analysis, finding the reason for the spike. By retaining the conversation, anyone with access to the sales analysis can visually play back what was said and see the context of the discussion visually.
This saves staff time – they don’t need to rediscover the reason for what may well be a very common question.
In the sections below, we step though these events, culminating in our conclusions on this new functionality in Power BI.
Let’s have a look
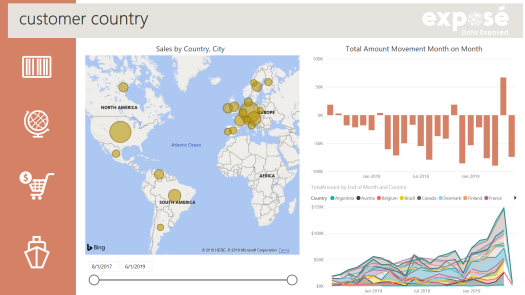
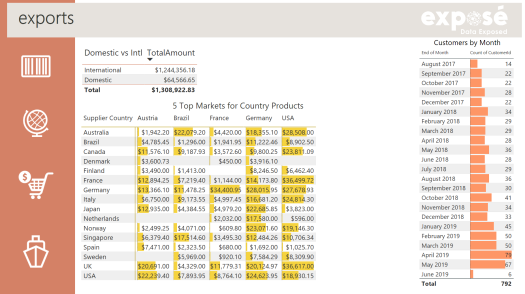
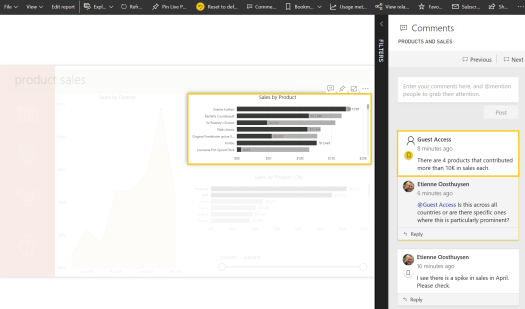
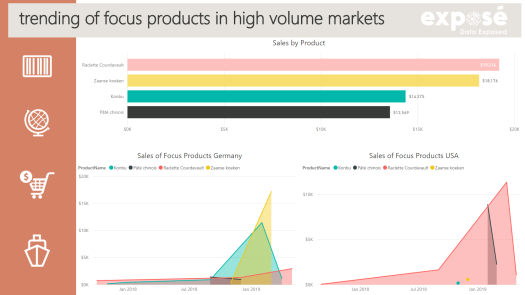
The first set of images shows the 4 relevant visuals the Head of Sales would have initially looked at, either on his laptop or on his mobile phone. They analyse sales through the lenses of Product, Customer Country, Export (Supplier Country) and Sales (over time) respectively.
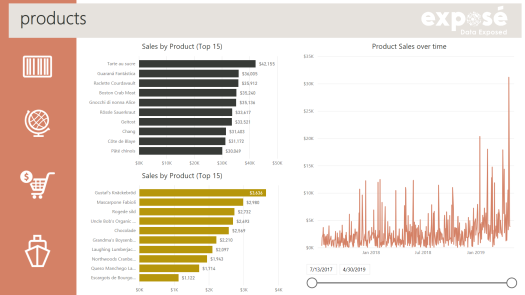
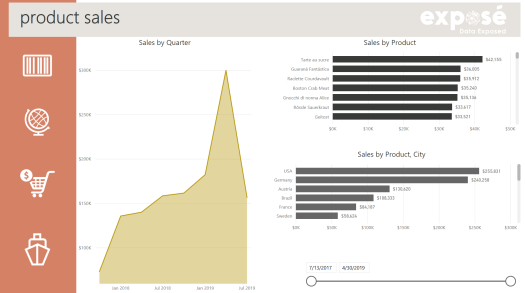
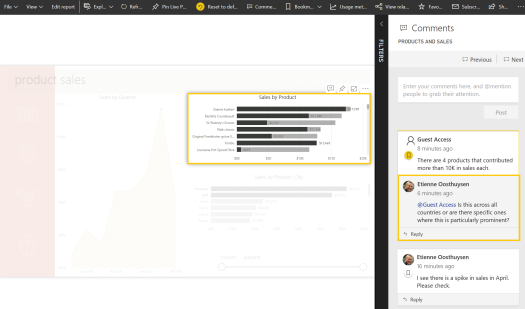
The Head of Sales picks up the unusual spike in April in the 4th visual, Product Sales. And he posts his first comment.

This comment is then picked up by one of the Sales Managers, who conducts some interactive analysis and subsequently responds to the Head of Sales. The Head of Sales is notified, clicks on the comment to see the full visual context – see how selecting the comment plays back the visual as it would have looked appeared when the comment was made, and spotlights the specific played back visual clearly showing the 4 products.

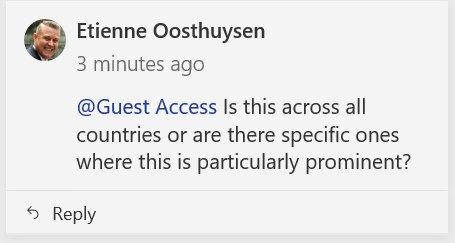
The Head of Sales now has a further comment, asking for clarification as to where these 4 specific products are sold.
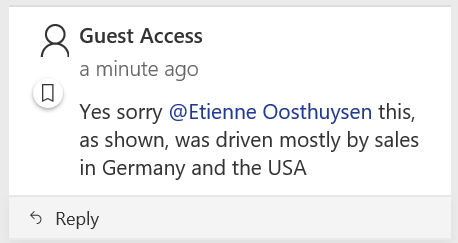
This specific Sales Manager (note I simply use one of our guest accounts to represent him) is notified of the comment and does further interactive analysis, and responds.
The Head of Sales is notified of the new comment and clicks on the new comment to see the full visual context – selecting the comment again plays back the visual to what it would have looked like when the comment was made, and spotlights the specific played back visual clearly showing the 2 countries.
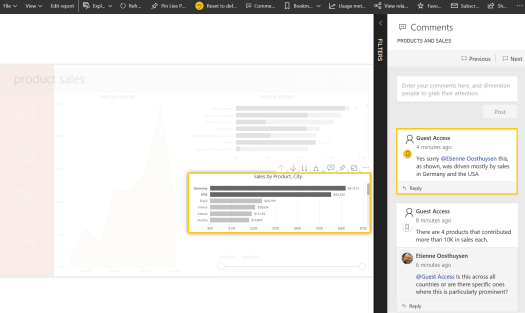
This now gives the Head of Sales enough context to understand what lead to the spike. He/ his delegate now jump into Power BI and create a new visual from the user friendly sales model that will continue to track and trend these 4 specific ‘focus’ products within the Germany and US ‘high volume’ markets. This shows them that they are becoming popular and that they should invest in some additional marketing around those 4 products.
How this works
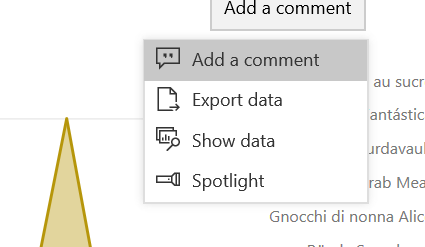
Using commentary requires no update or reinstall. Simply navigate to your report in Power BI Service and create comments. This can be done on the visuals themselves after analysis has been done to retain the context.
On on the report page in totality.
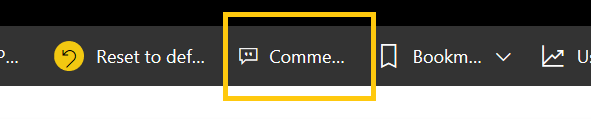
In my sales example here, I used a combination of the report page and specific contextual visual commentary in my discussion. The comments page will show all relevant comments and selecting any one of them will play the report and the context back to the time of the report.
Conclusion
The new commentary capabilities are still object based, and not intimately linked to the data as it was, for example in Business Objects – where commentary is made and written back to the solution based on the actual intersection of data—for example, a Sales Value of Product X for 1st of January 2019, in Vancouver in Canada, by Mary Jackson. The difference, however, could be quite subtle as Power BI could allow for the comment on a visual that shows the Sales Value has been filtered to Product X for 1st of January 2019, in Vancouver in Canada, by Mary Jackson.
One of the main downsides of this object based approach is that the commentary data itself remains inaccessible if you, for example, wanted to use it as raw contextual time based data itself. Disclaimer: I say this data is inaccessible, as I am unaware of where it would be stored or accessed. Happy to be advised of the contrary
The ability to play the report and visuals back to what it looked like when the comment was made is, however, a very nice feature—the reader can as it were, “step back in time” and see what happened when the comment was made. This seems to be the case even as more data is appended to the model (in this case) on an hourly basis.
There is no workflow attached to the commentary, which is quite common in financial reporting where commentary and narrative undergo review and approval.
This feature is not available to public facing reports using the “Embed to Web” functionality. But if you’re interested in looking at the sample reports I used for this user story, they can be viewed and interacted with here.